San Diego's Real Estate Riddle: More Homes, Fewer Sales. What Gives?
San Diego's Real Estate Riddle: More Homes, Fewer Sales. What Gives? 🤔
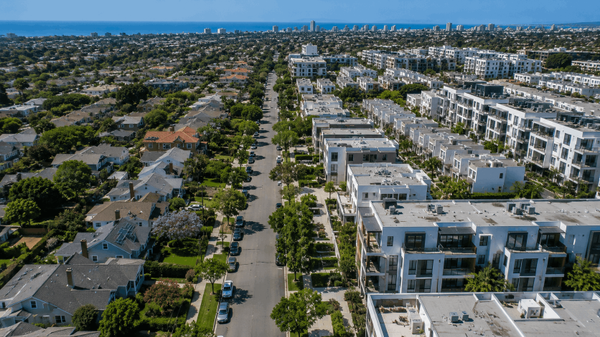
San Diego Housing Market Update – Week Ending June 8, 2025

This week in San Diego real estate feels like a paradox. On one hand, active inventory has absolutely exploded compared to last year, giving buyers the most choice they've seen in a long time. Detached home inventory is up a staggering 62% year-over-year, with condos and townhomes not far behind at an eye-watering 81% increase. Yet, despite a recent bump in weekly activity, the number of homes actually selling is down significantly from a year ago.
Let's dive into the numbers and unpack what this growing gap between supply and sales really means.
🏠 DETACHED HOMES – Week Ending June 8, 2025
| Metric | This Week | Last Week | vs Last Week | 4-Week Avg | % vs 4-Week Avg | Same Week Last Year | % Change YoY |
|---|---|---|---|---|---|---|---|
| New Listings | 422 | 354 | ▲19% | 382 | ▲10% | 398 | ▲6% |
| Newly Pending | 276 | 230 | ▲20% | 284 | ▼2.8% | 308 | ▼10% |
| Newly Sold | 274 | 225 | ▲22% | 256 | ▲7% | 366 | ▼25% |
| Median DOM | 18 | 17 | ▲1 | 16 | ▲2 | 17 | ▲1 |
| Average DOM | 32 | 32 | -- | 30 | ▲2 | 31 | ▲1 |
| Active Inventory | 3,553 | 3,465 | ▲2.5% | 3,405 | ▲4.3% | 2,193 | ▲62% |
| Weeks of Inventory | 13 | 15.5 | ▼2.5 | 12 | ▲1 | 6.5 | ▲6.5 |
| Median Sold Price | $1,091,000 | $1,099,900 | ▼.81% | $1,142,475 | ▼4.5% | $1,089,900 | ▲.14% |
| Median SP/SF | $603.36 | $630.06 | ▼4.2% | $623.32 | ▼3.2% | $626.69 | ▼3.7% |
Data for San Diego County detached single-family homes. The story of the year is the 62% surge in active inventory compared to 2024.
For single-family homes, the story is all about supply. Active inventory is up 62% from last year, a massive shift that is reshaping the market. We saw a healthy jump in new listings this week, which is good for buyers craving choice. However, demand isn't keeping pace. The number of homes going into escrow (Newly Pending) is down 10% year-over-year, and more telling, completed sales are down a full 25%.
The most fascinating part? Prices are holding their ground. The median sold price is virtually unchanged from this time last year, showing remarkable resilience. This tells me that while buyers have more options, sellers are not in a panic. They're just having to wait a bit longer to find the right buyer, as reflected in the slightly longer Days on Market (DOM).
🏢 ATTACHED HOMES (Condos/Townhomes) – Week Ending June 8, 2025
| Metric | This Week | Last Week | vs Last Week | 4-Week Avg | % vs 4-Week Avg | Same Week Last Year | % Change YoY |
|---|---|---|---|---|---|---|---|
| New Listings | 266 | 263 | ▲1.1% | 254 | ▲4.7% | 231 | ▲15% |
| Newly Pending | 132 | 129 | ▲3.1% | 135 | ▼2.2% | 146 | ▼9.6% |
| Newly Sold | 133 | 134 | ▼.75% | 132 | ▲.76% | 214 | ▼38% |
| Median DOM | 23 | 24 | ▼1 | 24 | ▼1 | 26 | ▼3 |
| Average DOM | 36 | 34 | ▲2 | 37 | ▼1 | 36 | -- |
| Active Inventory | 2,491 | 2,445 | ▲1.9% | 2,391 | ▲4.2% | 1,377 | ▲81% |
| Weeks of Inventory | 18.5 | 18 | ▲.5 | 16 | ▲2.5 | 8 | ▲10.5 |
| Median Sold Price | $615,000 | $710,000 | ▼13% | $703,625 | ▼13% | $675,000 | ▼8.9% |
| Median SP/SF | $596.93 | $601.99 | ▼.84% | $603.73 | ▼1.1% | $627.13 | ▼4.8% |
Data for San Diego County attached homes (condos, townhomes). An 81% YoY inventory boom and softening prices define this segment.
The condo and townhome market is experiencing an even more dramatic version of this story. Active inventory has skyrocketed by 81% compared to last year. That’s nearly double the available homes. This flood of supply, coupled with a major drop in sales (down 38% YoY), is putting significant pressure on prices.
Unlike the detached market, we're seeing clear price adjustments here. The median sold price for attached homes is down 8.9% from last year and down a sharp 13% compared to the recent 4-week average. This is a clear signal that the balance of power has shifted firmly into the buyers' court for condos and townhomes.
💡 What This Means for You
🟢 For Buyers
Your moment has arrived. With inventory for detached homes up 62% and attached homes up 81%, you have more choice and breathing room than at any point in the last few years. For condo/townhome buyers, the 8.9% year-over-year price drop means you have real negotiating power. For detached home buyers, don't expect a fire sale, but do expect to tour homes without a massive crowd and to write offers with reasonable terms.
🔵 For Sellers
The market has turned. Strategy is everything now. For detached home sellers, your price resilience is a gift, but don't take it for granted. You must price your home correctly from day one to stand out against the 62% increase in competition. For attached home sellers, you are in a tough spot. With inventory up 81% and prices down, your marketing, staging, and pricing strategy have to be flawless to capture a buyer's attention.
🟡 For Homeowners
Your equity in a detached home remains strong and stable, a testament to the long-term value of San Diego real estate. The rapid, fever-pitch appreciation has cooled, which is a sign of a healthier, more sustainable market. For those in attached homes, you've likely seen a slight dip from peak values, but your equity is still substantial compared to pre-pandemic levels. This is a good time to enjoy your home and not stress about short-term fluctuations.
🛠️ Pro Tip of the Week
In a market with swelling inventory, the old strategy of "pricing high to leave room for negotiation" is a recipe for failure. The listings that get the most attention and the best offers are priced at fair market value from the start. This creates urgency and attracts serious, qualified buyers who are tired of looking at overpriced homes. Don't let your property become a stale listing; price it right to sell it right.
Categories
Recent Posts