
Rates Are Down, But Where Is the San Diego Market Really Heading?

Rates Are Down, But Where Is the San Diego Market Really Heading?
San Diego Housing Market Update – Week Ending November 2, 2025

This week's data is sending some fascinating, conflicting signals. On one hand, we're seeing a clear seasonal slowdown, with pending sales dipping compared to last week and the prior four-week average. On the other hand, mortgage rates have just hit their lowest point in over a year, a powerful motivator for buyers.
So, which force will win out? Will lower rates spark a late-Fall uptick in activity? Or will the typical seasonal trends, combined with broader economic concerns from the ongoing government shutdown, keep buyers and sellers on the sidelines? The story isn't the same for every property type. Let's dive into the numbers.
🏠 DETACHED HOMES – Week Ending 11/02/25
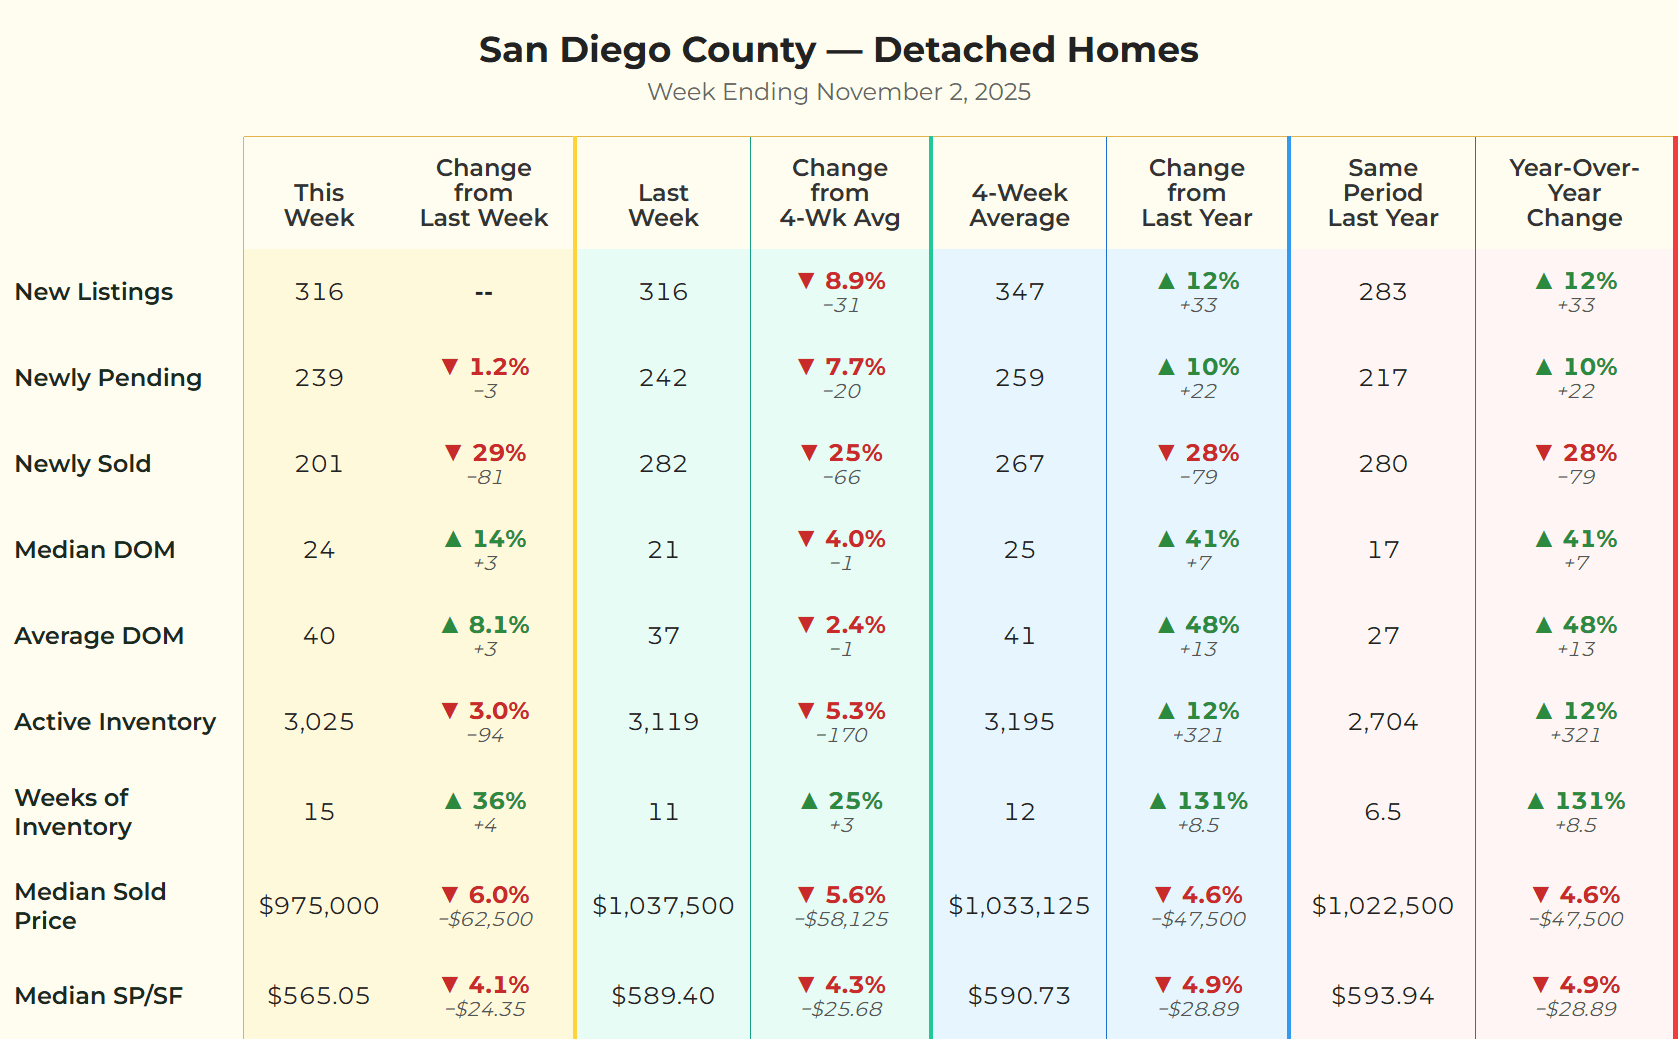
Data for San Diego County detached single-family homes. Source: SDMLS | Analysis by Matt O'Brien, Realtor.
The detached home market clearly shows the push-and-pull I mentioned. Demand, as measured by pending sales, is down 7.7% from the 4-week average, reflecting that typical holiday-season cooling. However, looking at the bigger picture, demand is significantly stronger than last year, with pending sales up 10% year-over-year. This tells me that buyers are more active and confident than they were in late 2024.
Buyers are also benefiting from more choice (active inventory is up 12% YoY), which is keeping prices in check. The Median Sold Price is 4.6% lower than the same week last year and also down 5.6% from the 4-week average. Homes are also sitting for about a week longer (24 Median DOM vs. 17 last year), giving buyers crucial time to think and negotiate.
🏢 ATTACHED HOMES (Condos/Townhomes) – Week Ending 11/02/25
[Attached Homes Chart Image Placeholder]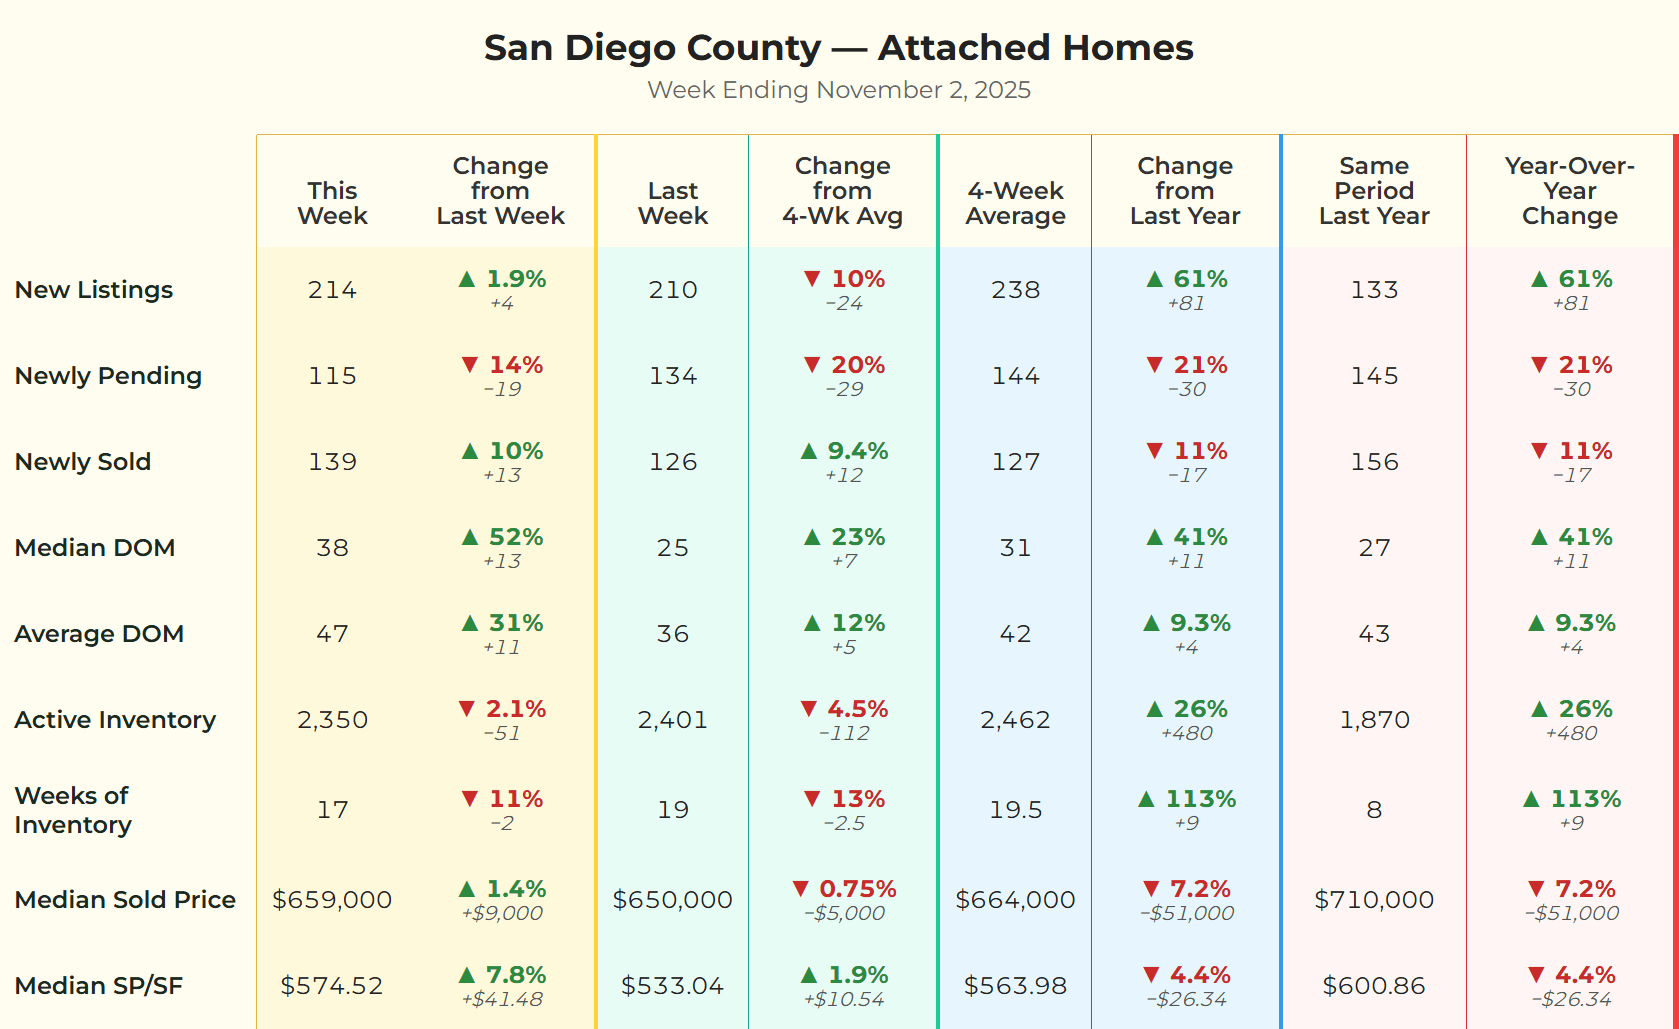
Data for San Diego County attached homes (condos/townhomes). Source: SDMLS | Analysis by Matt O'Brien, Realtor.
The story for attached homes is all about inventory. This week's 61% year-over-year jump in new listings looks dramatic, but it's largely because this exact week last year was unusually slow (133 new listings). A much better comparison is to the 4-week average from this time last year (which was 158), and even by that measure, new listings are up a very strong 35%. This sustained increase, combined with a 26% rise in total active inventory, signals a significant increase in choice for buyers.
Unlike the detached market, however, buyer demand for attached homes is down significantly, with pending sales down 21% from last year and 20% from the recent 4-week average. With so much more to choose from and far less competition, buyers are clearly in the driver's seat. This has led to a significant price correction: the Median Sold Price is down 7.2% from last year, and homes are taking much longer to sell (38 median days on market vs. 27 last year).
💡 What This Means for You
Across the board, the biggest news is the drop in mortgage rates. National forecasts place the 30-year fixed in the low 6% range (around 6.17% to 6.34%), with FHA and VA rates potentially even lower for qualified buyers. This is providing a crucial boost to affordability.
🛒For Buyers:
This is a moment of leverage. You have the seasonal slowdown working in your favor, creating less competition right now. You also have more choices (inventory is up 12-26% YoY) and more negotiating power (prices are down 4-7% YoY). The drop in rates is the cherry on top, giving your purchasing power a real boost. For attached homes, you are firmly in control.
💰For Sellers:
The game has changed. Pricing your home correctly from day one is non-negotiable, especially during a seasonal slowdown. With more inventory on the market than last year, your property must be dialed in on price and presentation. For detached homes, underlying demand is still solid, so a well-marketed home will attract the right buyers. For attached homes, be prepared for longer market times and aggressive negotiations.
🪺For Homeowners:
This market correction is healthy. The price drops we're seeing are bringing the market back toward sustainable, pre-pandemic trend lines. Your equity is likely still at a very healthy level. This data simply confirms that the days of 20%+ annual price gains are over, replaced by a more stable and balanced environment.
📞 Ready to Make Your Move?
The market is complex, with different segments moving at different speeds. Whether you're a buyer seeing this window of opportunity, a seller needing a strategy to stand out, or a homeowner looking to reassess your equity, I'm here to help you navigate it.
Let's talk about what these numbers mean for your specific goals.
Categories
Recent Posts