
San Diego's Split-Screen Market: Detached Holds Firm While Condos Find Their Floor

🏠 San Diego's Split-Screen Market: Detached Holds Firm While Condos Find Their Floor
San Diego Housing Market Update | Week Ending May 3, 2026

San Diego is running two very different markets right now, and the gap between them is widening. Detached single-family homes are showing real resilience: buyer demand is holding steady, fresh listings are getting absorbed quickly, and the 4-week rolling average price sits at $1,119,472. Condos and townhomes are telling a different story entirely, with 17 weeks of inventory on hand and prices on a gradual downward trend.
The most important thing to understand before we dive in: sold prices are a lagging indicator. They reflect deals that went under contract 3 to 6 weeks ago, not what's happening at open houses this weekend. The leading indicators, new listings coming onto the market and newly pending sales going under contract right now, are where you want to look to understand where things are actually headed.
Let's break both sides down.
🏠 Detached Homes — Week Ending May 3, 2026
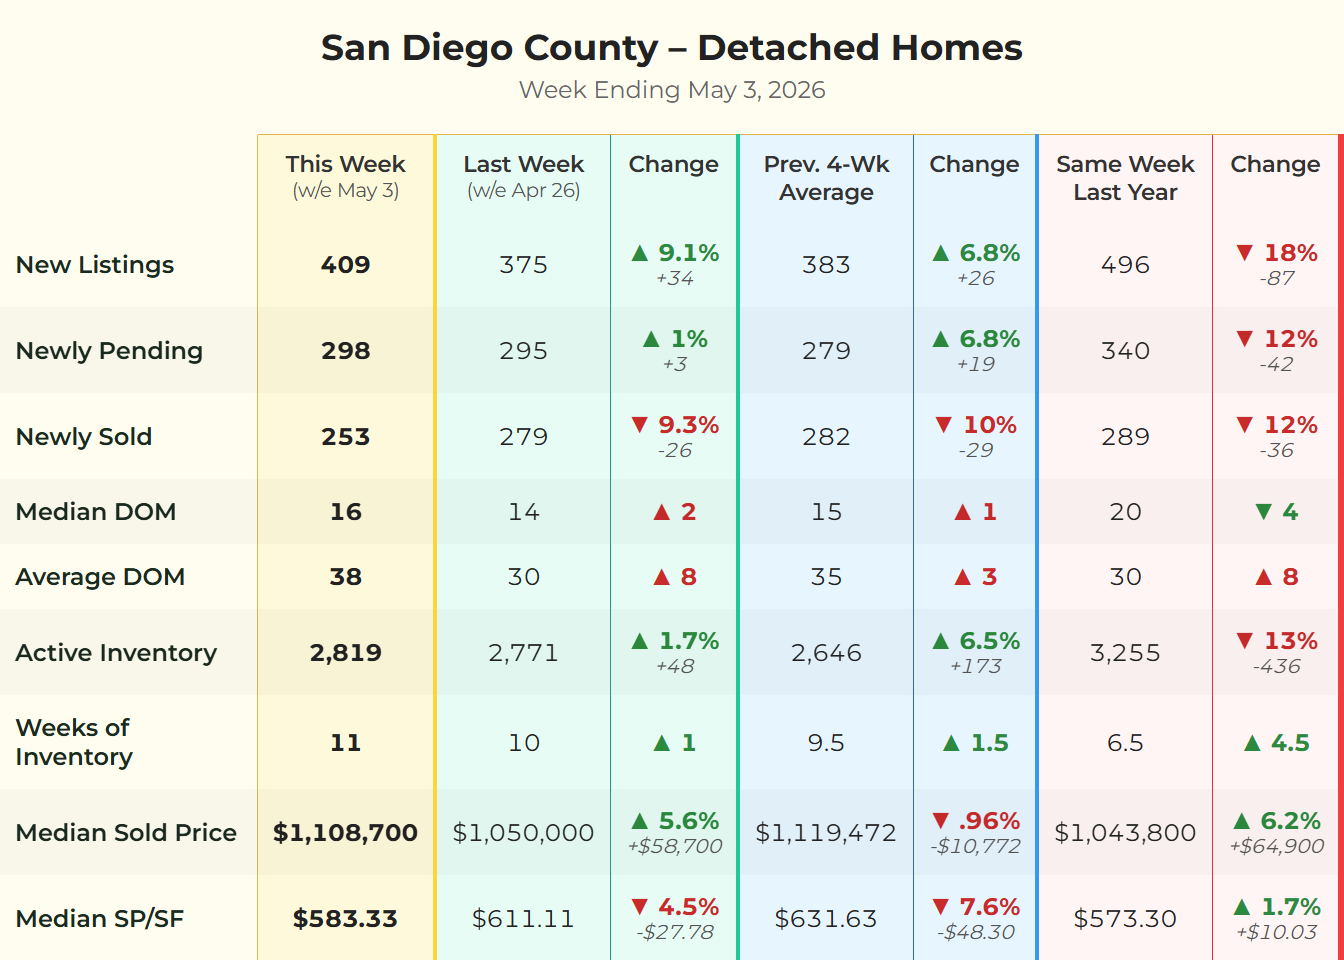
The leading indicators this week are encouraging. New listings jumped 9.1% week over week to 409, which puts us 6.8% above the 4-week average and signals that more sellers are feeling confident about this spring market. Importantly, buyers are keeping pace. Newly pending sales came in at 298, sitting 6.8% above their own 4-week average of 279. More supply is coming in, and demand is absorbing it. That's a healthy, balanced dynamic.
What I find particularly telling is the fresh absorption rate. This week, 103 detached homes went under contract within 14 days of listing. That's down slightly from last week's 119, but it still means roughly 1 in 3 new listings is getting snapped up almost immediately. The best-priced, best-presented homes are not sitting. Median days on market sits at just 16 days, and even with average DOM ticking up to 38 days (which reflects some longer-sitting, overpriced inventory dragging the average up), the core of the market is moving efficiently.
On price: the 4-week rolling average for detached median sold price is $1,119,472, essentially flat compared to the prior 4-week period and up solidly from this time last year. That's the number I trust to tell the real pricing story, smoothing out the week-to-week noise. The conditions supporting that price level, strong pending activity, lean inventory at 11 weeks, and fast absorption of quality listings, are all still in place heading into May.
🏢 Attached Homes (Condos/Townhomes) — Week Ending May 3, 2026
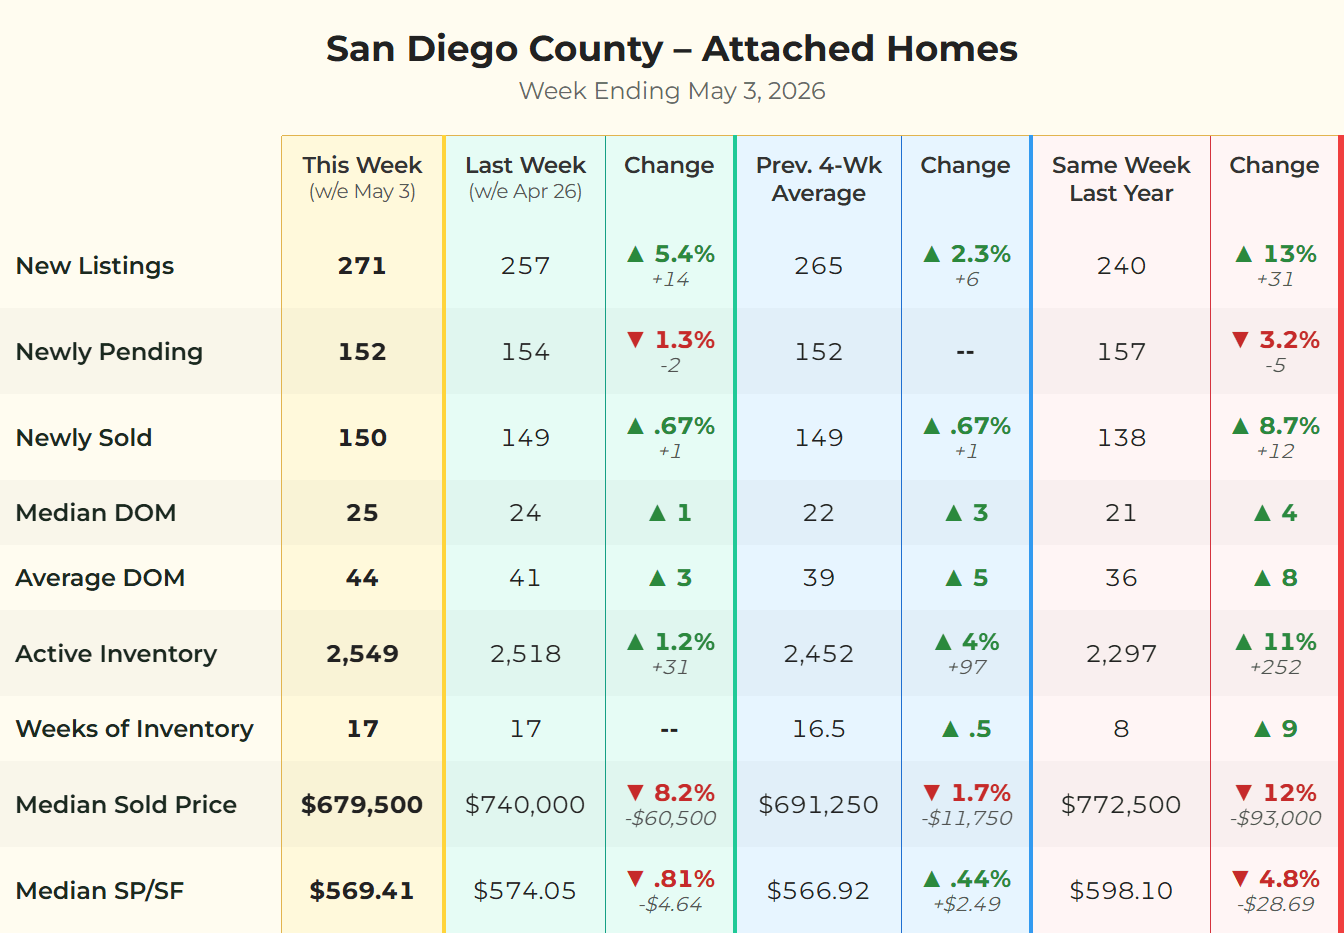
The attached market is in a different chapter right now. Active inventory has climbed to 2,549 units, up 4% above the 4-week average and 11% above this time last year. New listings rose 5.4% to 271 this week, while newly pending sales came in at 152, exactly flat against the 4-week average. Supply is growing faster than demand is absorbing it, and that math is putting downward pressure on prices and upward pressure on days on market.
A note on the weeks of inventory comparison: the chart shows 17 weeks of inventory this week versus 8 weeks the same week last year. I want to give that some context. The 4-week rolling average for inventory sits at 16.5 weeks, which confirms this isn't a one-week anomaly. This is a genuine, sustained shift in supply. The same-week-last-year figure of 8 weeks likely reflected a particularly tight moment in the spring 2025 condo market, so while the year-over-year gap looks dramatic, the 4-week average tells the more reliable story: attached inventory has roughly doubled from where it was running a year ago.
The 4-week rolling average for attached median sold price is $691,250, down modestly from the prior 4-week period. This isn't a crash. It's a rational recalibration. Average days on market is now at 44 days, up 8 days from last year. And the fresh absorption story here is notably quieter than detached: only 35 attached homes went pending within 14 days this week. For context, that's about 1 in 8 new listings versus roughly 1 in 3 for detached. Buyers in this segment genuinely have more room to breathe, negotiate, and be selective.
💡 What This Means for You
🛒 For Buyers
If you're focused on detached homes, the market is active and the best homes are still moving fast. Get pre-approved, know your number, and be ready to move when the right home appears. That said, this isn't the frenzy of 2021. There's room to negotiate on condition, repairs, and closing terms even if sellers aren't budging much on price. Being prepared and decisive is your biggest advantage right now.
If condos or townhomes are on your radar, this is genuinely one of the more buyer-friendly windows we've seen in years. With a 4-week average of 16.5 weeks of inventory, motivated sellers, and days on market stretching out, you have time to be thoughtful and leverage to ask for things. The gap between detached and attached pricing has never been wider. For buyers who've been priced out of the detached market, the condo and townhome segment is quietly becoming the smartest entry point in San Diego.
💰 For Sellers
Detached home sellers are in a strong position. The 4-week rolling average price is holding above $1.1 million, pending activity is running above average, and quality homes are still generating real interest. The key is pricing sharply from day one. The data shows a clear split between homes that move in 14 days and homes that linger for 38 or more. The difference almost always comes down to the opening price, not the home itself.
If you're selling a condo or townhome, you're working in a more competitive landscape and buyers know it. Presentation, pricing, and flexibility on terms are your three biggest levers. The good news: homes that are priced to reflect current conditions and show well are absolutely still selling. It just takes more strategy and a realistic conversation about where the market actually is right now.
🪺 For Homeowners
If you own a detached home, your equity position remains strong. The 4-week rolling average of $1,119,472 reflects genuine, sustained demand, not a one-week spike. If you've been curious about a HELOC, a cash-out refinance, or simply want to know what your home is actually worth today, now is a good time to get a real number. I can put one together for you with no pressure and no obligation.
📈 For Investors
The attached segment deserves a serious look right now. With the 4-week rolling average price at $691,250 and inventory running at 16.5 weeks, the conditions for finding real value in condos and townhomes are better than they've been in several years. Cap rates are more compelling. Seller motivation is real. Just go in with clear eyes on HOA financials and reserve fund health, because those details matter more in a softer condo market.
📈 The Mortgage Rate Check-In
As of this week, the 30-year fixed mortgage rate is hovering in the mid-to-upper 6% range. Rates have been relatively stable over the past few weeks, and that stability, even at elevated levels, appears to be keeping buyers engaged. Certainty tends to move people off the fence faster than low rates alone. For the most current daily numbers:
📞 Ready to Make Your Move?
The data paints a clear picture this week, but data alone doesn't buy or sell a home. Your personal situation, your timeline, your goals, and your neighborhood are the variables that actually matter.
I'm not a closer. I'm a consultant. My whole approach is built around giving you the clearest possible picture of what the market is doing so you can make a smart, confident decision on your timeline.
Whether you're thinking about buying, selling, or just want to know what your home is worth right now, I'd love to connect. No pressure, no pitch. Just a real conversation.
Want to grab a coffee or hop on a call?
Let's Talk →Categories
Recent Posts