San Diego's Autumn Pause: Buyer Demand Cools (Pendings 11%) as New Listings Also Dip (9.7%)

San Diego's Autumn Pause: Buyer Demand Cools (Pendings ▼11%) as New Listings Also Dip (▼9.7%)
San Diego Housing Market Update – Week Ending October 26, 2025

This week in San Diego's housing market, we're seeing a clear and mutual pullback. Instead of the usual supply vs. demand squeeze, it looks like both buyers and sellers tapped the brakes, signaling a distinct autumn cooldown.
The story is led by the detached homes market. Buyer demand (Newly Pending Sales) fell, dropping 13% from last week and 11% below the 4-week average. At the same time, sellers brought fewer new homes to market, with New Listings down 9.7% compared to the 4-week average. While a slowdown in both listings and sales is a typical seasonal trend for fall, it's important to note that pending sales are also down 13% compared to this same week last year. This is a key metric we'll be watching.
This cooling in activity is now being seen in the (lagging) sold prices, which also ticked down. The attached market is following a similar, though slightly different, trajectory. Let's dive into the numbers.
🏠 DETACHED HOMES – Week Ending 10/26/25
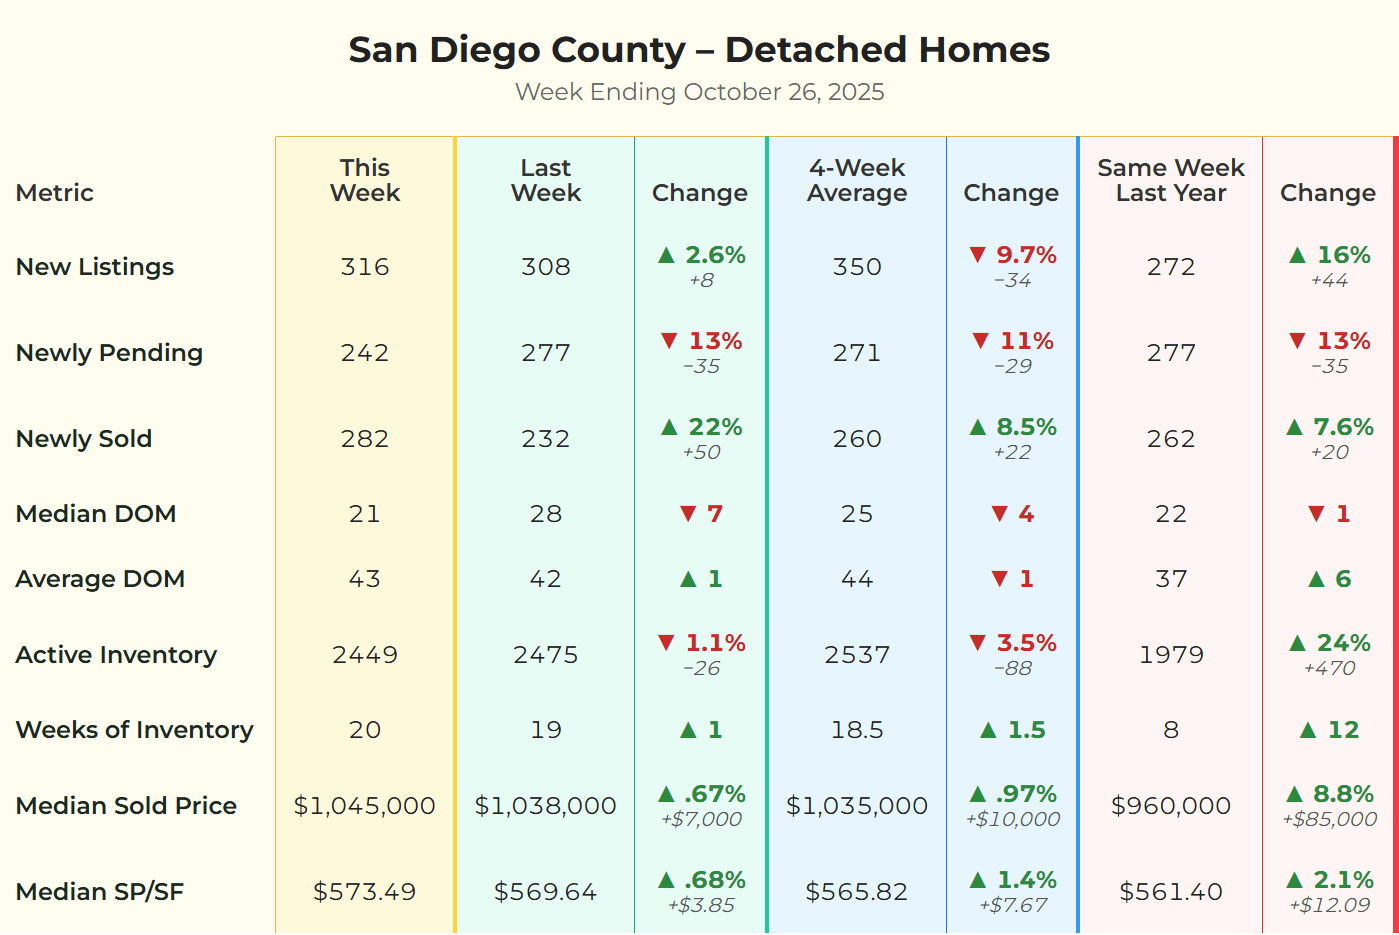
Data for San Diego County detached single-family homes. Source: SDMLS | Analysis by Matt O'Brien, Realtor.
The most significant number this week is the drop in newly pending sales, which fell to 242. This is a sharp 13% drop from just last week and 11% below the 4-week average, showing a clear hesitation from buyers. This was met by a pullback from sellers, with New Listings (316) also coming in below the recent average. With fewer new homes and fewer new escrows, the market is in a temporary state of pause.
We're now seeing this slowdown reflected in closed sales. The Median Sold Price, which reflects deals made 3-6 weeks ago, dipped to $1,037,500. This is 2.6% lower than last week and just under 1% lower than the same week last year. Given that this week's buyer demand (a forward-looking metric) also fell, it suggests that the intense upward price pressure we saw earlier in the year has eased.
🏢 ATTACHED HOMES (Condos/Townhomes) – Week Ending 10/26/25
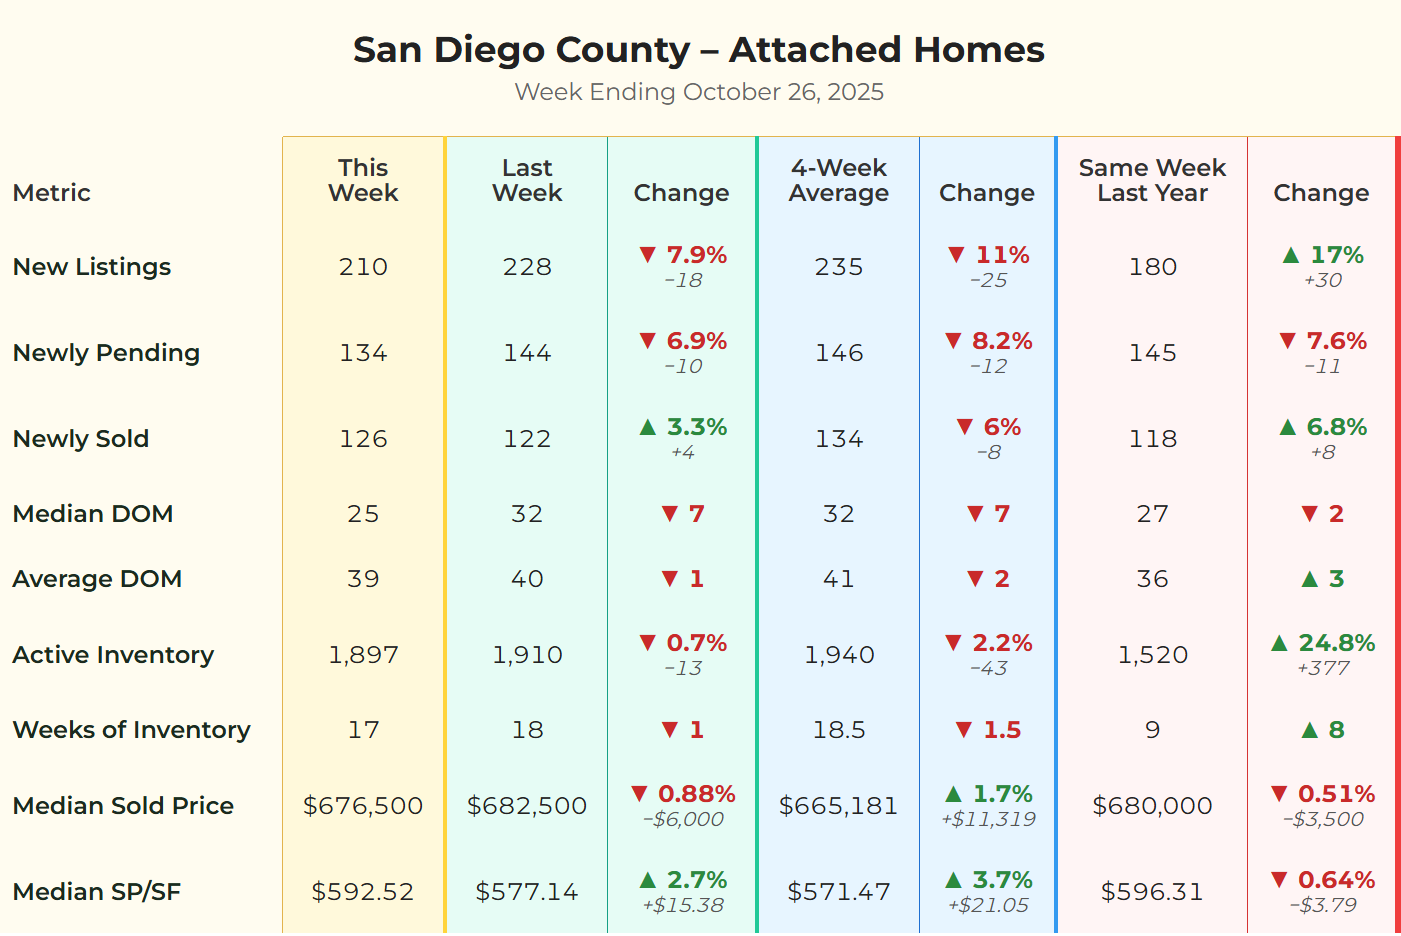
Data for San Diego County attached homes (condos/townhomes). Source: SDMLS | Analysis by Matt O'Brien, Realtor.
If you're a buyer frustrated by the detached market, the attached market is your breath of fresh air. The most dramatic number here is the Active Inventory: it's up 26% compared to this same week last year. This is a significant shift, giving condo and townhome buyers the one thing they haven't had in years: choice.
With more homes to choose from, demand cooled off this week. Pending sales dropped (down 6.9% from last week). This combination of soaring inventory and slowing demand pushed the 'Weeks of Inventory' up to 19 weeks (compared to just 8 weeks last year). Prices are reflecting this new balance; the median sold price of $650,000 is down 3.9% from last week and 1.4% from last year. This is a stable, rational market where buyers can finally negotiate.
💡 What This Means for You
For Buyers 🛒
This is a "choose your own adventure" market. If you're looking for a detached home, the 11% drop in pending sales means you're facing less competition right now. This is a moment to be patient and negotiate. If you're looking at condos, you have the distinct advantage. That 26% jump in inventory is your negotiating power. Take your time, see a few properties, and don't be afraid to write an offer that makes sense for you.
For Sellers 💰
Your strategy depends entirely on your property type. If you're selling a detached home, this week's data is a signal that pricing is now more critical than ever. With buyers pausing, you must be the best-prepared and best-priced home to attract a serious offer. If you're selling a condo, you have more competition than at any point last year. Your home must shine in photos and be priced sharply to stand out from the 26% increase in other listings.
The Mortgage Rate Check-In 📈
I'm also keeping a close eye on the national picture. As of today, October 27th, rates are holding steady. Bankrate shows the 30-year fixed average at 6.21%, while Mortgage News Daily reports 6.19%. This stability, even at an elevated level, is a key factor. It seems to be contributing to the buyer pullback, as the urgency from rapidly *rising* rates is gone, but the high cost of borrowing remains a significant hurdle.
- Read More: Today's Mortgage Rates from Bankrate
- Read More: Daily Rate Index from Mortgage News Daily
📞 Ready to Make Your Move?
The data is one thing; your personal situation is another. These numbers show opportunities and challenges on both sides of the market. The key is to have a strategy that fits your specific goals.
If you're thinking about buying or selling, or just want to understand what your home is worth in this evolving market, I'm here to help. I'm not a "closer," I'm a consultant. My job is to give you the data and guidance you need to make a smart, confident decision.
Categories
Recent Posts